Todo por no RTFM (o cómo usar matplotlib con R)
Quien escribió Call matplotlib from R podía haberse ahorrado bastante trabajo de la peor especie (programación de bajo nivel con C++) leyendo los benditos manuales (de rPython, en este caso).
Le bastaba hacer
library(rPython)

x <- seq(0, 2*pi, length = 100)
sx <- sin(x)
cx <- cos(x)

python.assign("x", x)
python.assign("sx", sx)
python.assign("cx", cx)

python.exec("import matplotlib.pyplot as plt")

python.exec("plt.rcParams.update({'figure.figsize' : (7,4)})")
python.exec("plt.plot(x, sx)")
python.exec("plt.plot(x, cx, '--r', linewidth=2) ")
python.exec("plt.legend(('sin(x)', 'cos(x)'))")
python.exec("plt.savefig('2015-04-02-pyplot.png')")
para obtener
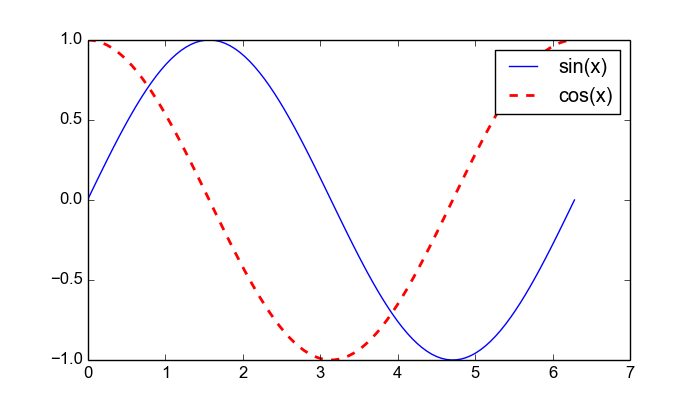
con una fracción del esfuerzo y sin reinventar la rueda.
Nota: por supuesto, tienes que tener matplotlib instalado. E.g., sudo apt-get install python-matplotlib